Dashboards
Dashboards arrange query results on a grid, built for watching rather than authoring. They live in Library → Dashboards.
The dashboard list
The same four tabs as Queries, behaving the same way: All Dashboards / My Dashboards / Favorites / Archive, each a real link so tabs are bookmarkable and the back button steps between them.
The Archive tab matters more here than elsewhere. An archived dashboard appears in no other listing, so this tab is the only route back to one.
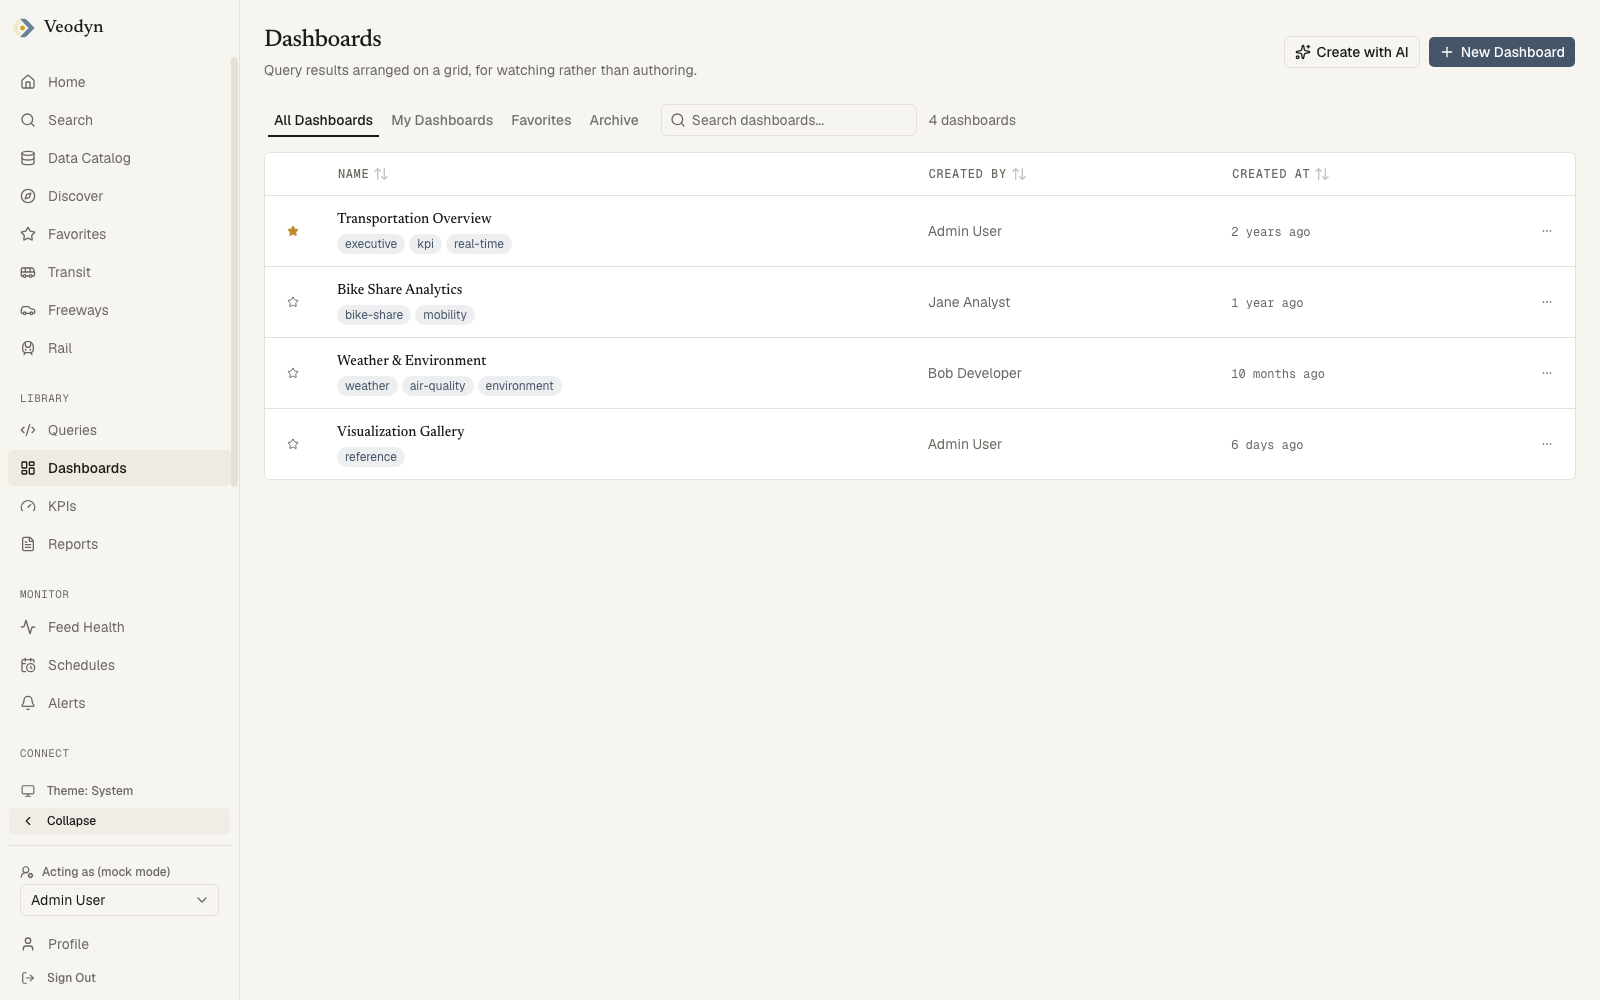
Each row shows a star, the name with its tags, who created it, and when. Name, Created By and Created At all sort, over the whole library rather than the visible page, and lists break at 25 rows.
The row menu offers Archive, or Restore on the Archive tab, and appears only if you may modify that dashboard. Archiving asks first: it takes the dashboard out of your lists and stops any public link to it working, though you can restore it from the Archive tab.
New Dashboard asks only for a name and drops you straight into the empty dashboard to add widgets. Create with AI appears alongside it when AI is enabled.
As on Queries, the search box filters All Dashboards only. On My Dashboards, Favorites and Archive it accepts what you type and the list does not change, while the count beside it keeps reporting the unfiltered total. Treat those three as complete lists you sort and page rather than search.
Viewing a dashboard
The header carries the dashboard's editable name, star, tags, and a Refresh rate picker (Never, 1 minute, 5, 10, 30 minutes, 1, 12, or 24 hours) that keeps every widget current while the page is open. The rate is a property of your open page, not of the dashboard: close the tab and nothing keeps refreshing.
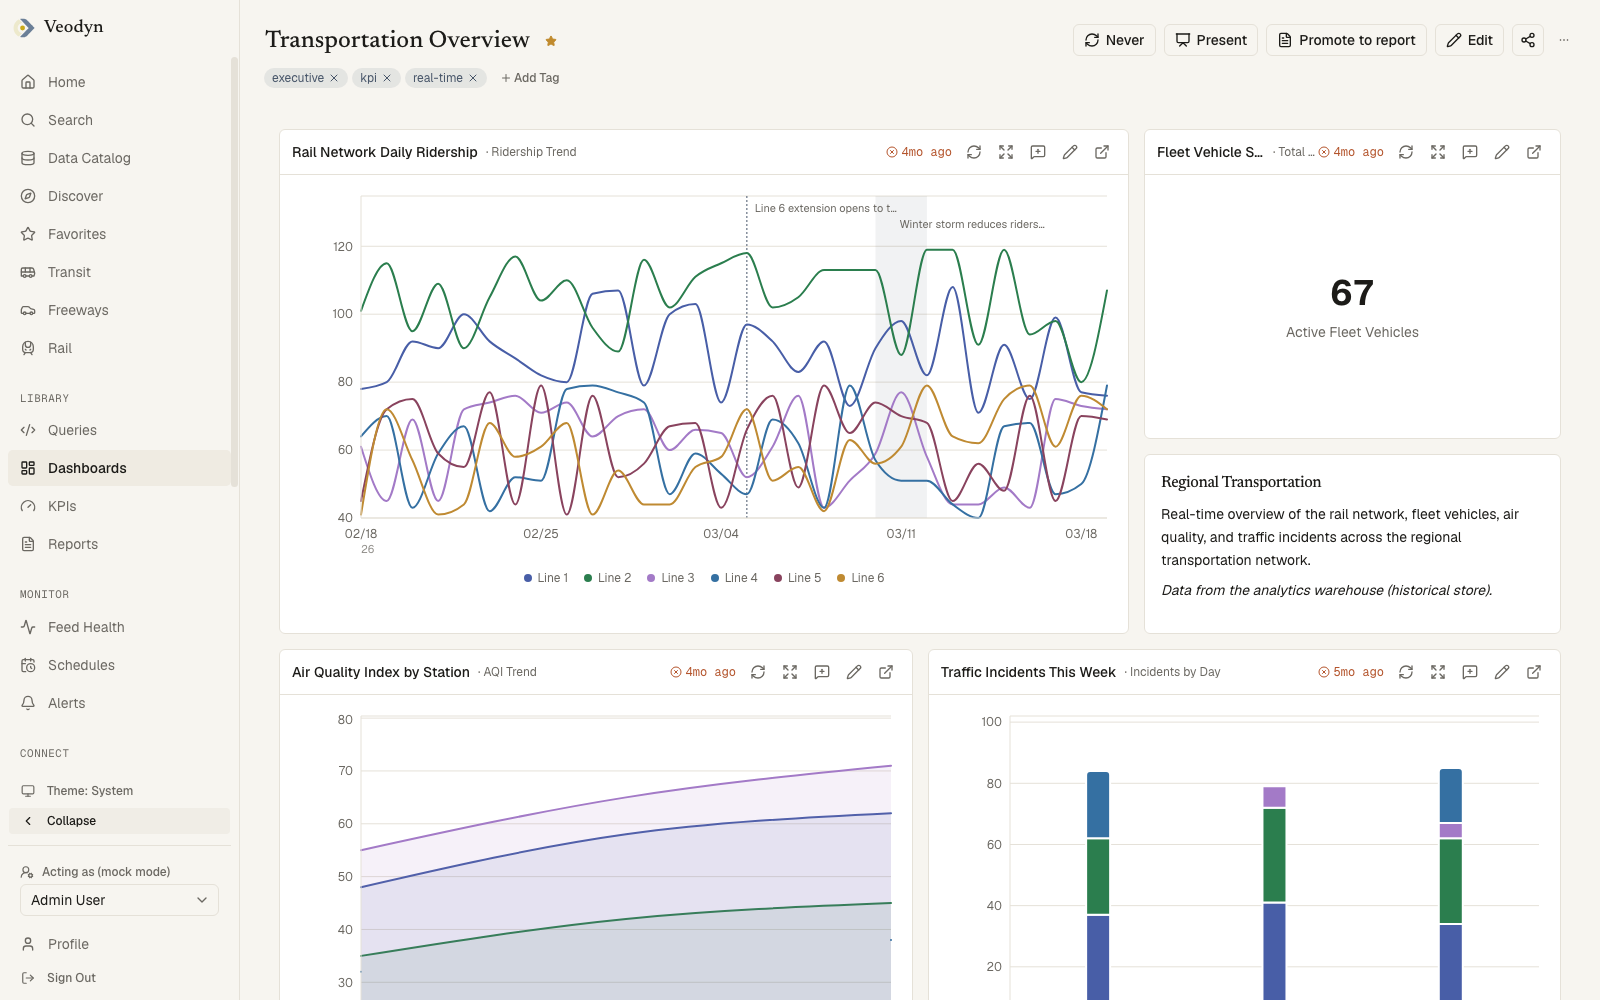
If widgets declare mapped parameters, a dashboard-level parameters bar appears, driving all mapped widgets at once. It is hidden while you are editing, since a control that re-runs every widget is noise when you are moving them around.
Each widget's chrome shows how old its data is, then offers Refresh, Expand (full-size view), Annotate, Edit visualization, Open query, and Remove widget (the last three only in the right modes and permissions).
It is drawn on every widget that has data, in the same green the rest of the product uses to mean Fresh. A widget refreshed an hour ago and one six days stale look identical. Read the age next to it, and ignore the colour: real fresh-versus-stale thresholding exists in the catalog and on Feed Health, but has not reached dashboard widgets.
Header actions:
- Edit: switches the page into editing, where the header swaps to + Widget, Textbox, Edit with AI and Done Editing.
- Share: opens the sharing dialog, which mints or revokes the public link.
- The overflow menu holds Archive, which returns you to the dashboard list rather than leaving you on a page that no longer resolves.
- Present (enterprise): opens presentation mode.
- Promote to report (enterprise): copies each widget's query and visualization into a new report draft and opens the block editor. It is a copy, not a link: the new report carries nothing pointing back here, so the two drift apart from that moment on.
Editing
Edit mode makes widgets draggable and resizable; the layout persists as you arrange it. The toolbar offers:
- Widget: add a visualization. Pick a query, pick one of its visualizations, then map any parameters it takes: to a widget-level control, a new dashboard-level parameter, a static value, or a keyword.
- Textbox: freeform markdown with a live preview, for headings and commentary between charts.
- Edit with AI (when AI is on): describe a change and review the proposed diff as added / removed / redrawn panels before applying. See AI Features.
- Done Editing.
Annotations
The Annotate action opens the annotations dialog: add a label with a time window, applied to all widgets or a single one, and manage the existing list. Annotation times are UTC, matching the chart axis. On an enterprise build with AI enabled, Suggest annotations proposes drafts from outliers found in the actual series; each is reviewed and accepted individually, and an accepted draft passes the same validation as a manually created one.
Sharing
The Share Dashboard dialog has one switch: Public Access. On, it mints an unlisted URL anyone can view without signing in; off, the link stops working. Public dashboard pages render the widgets read-only. An organization can disable public URLs entirely with a feature flag in Settings, and on an enterprise build admins can also audit and bulk-revoke every live link at Admin → Shared Links.
Revoked or unknown links get a neutral "This dashboard is not available" page that never echoes the token.
Presentation mode (enterprise)
Presentation mode and wall mode below are part of the enterprise edition. They share one component and moved together, so a community build has neither route.
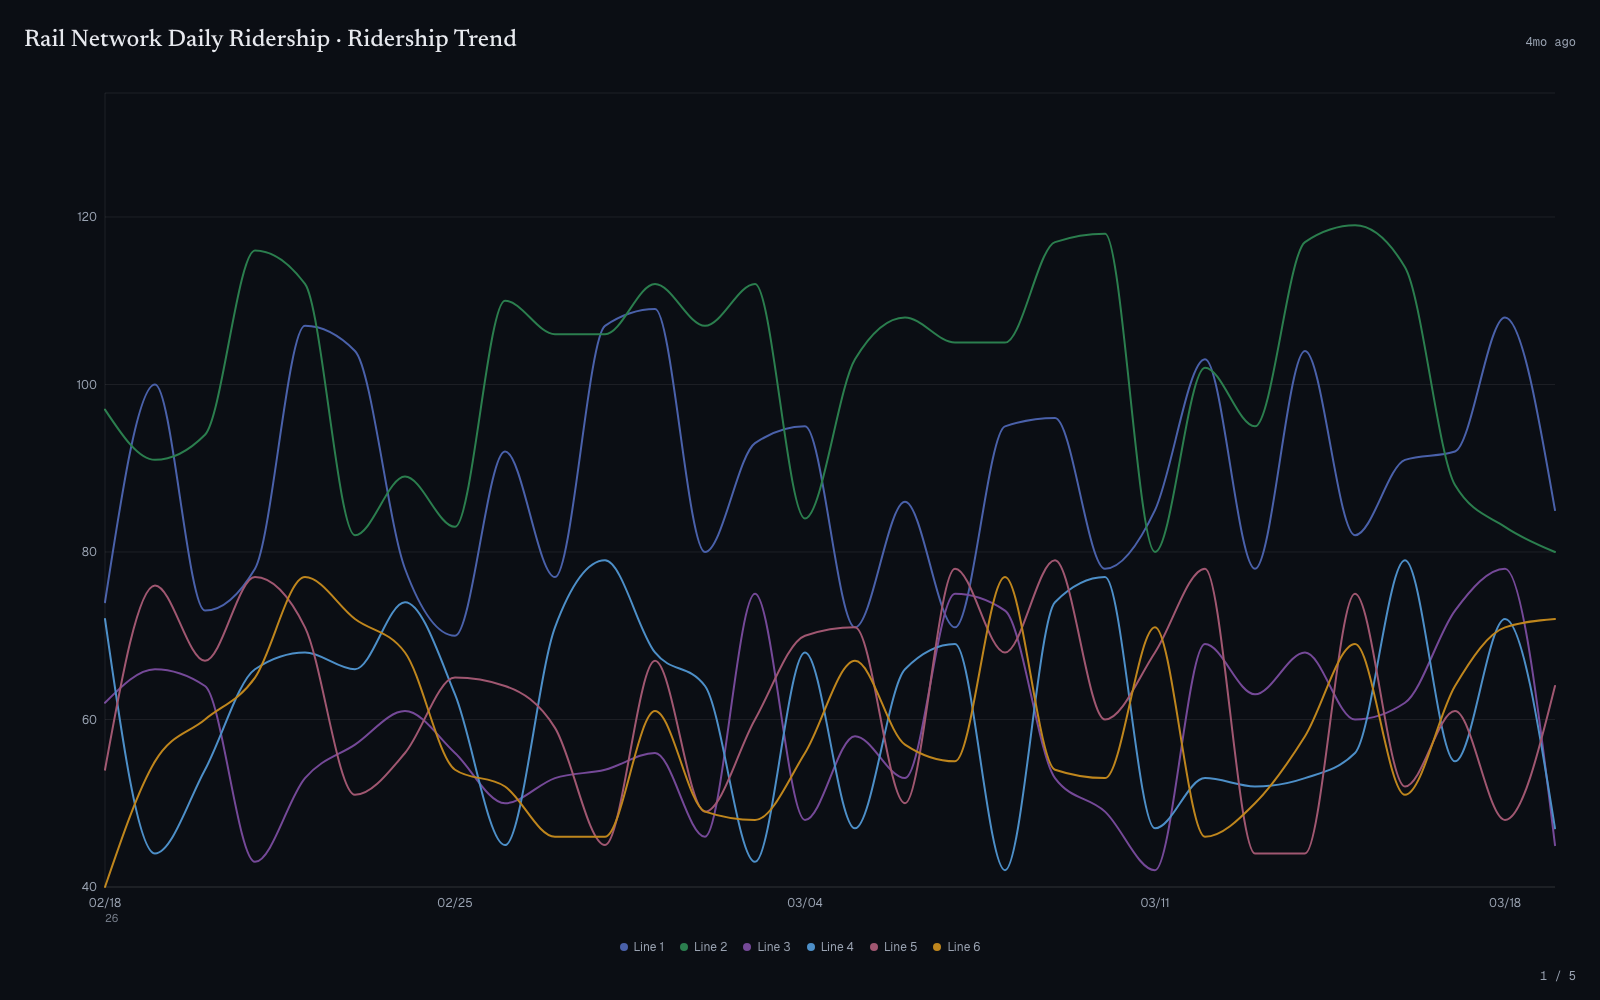
/present/<id> turns a dashboard into a full-screen deck: one widget per slide, no sidebar, no page chrome, and the browser asked to go fullscreen where it will allow it.
It is driven entirely by the keyboard. Right arrow and left arrow move between slides, Escape returns you to the dashboard. Nothing advances on a timer, so a slide stays up until you move it. A counter in the bottom-right corner shows your position, and each slide carries the widget's title, its presenter notes, and how old its data is.
A dashboard whose widgets are all hidden says so rather than presenting an empty deck.
The deck does not follow the arrangement you see on the dashboard. It plays widgets in the order the server returns them, roughly the order they were created, so a dashboard laid out to read top-left to bottom-right can present in a different sequence entirely. Step through the deck once before presenting it to anyone.
Wall mode (enterprise)
/wall is an unattended, chrome-free display for a lobby or operations-room screen. Unlike Present, it takes no keyboard input and shows one dashboard chosen by the operator rather than whichever one you opened.
Which dashboard is fixed in the instance config as wall_mode.default_dashboard. Until that is set, the page says Wall mode is not configured and names the setting to change, rather than showing an empty screen someone has to diagnose.
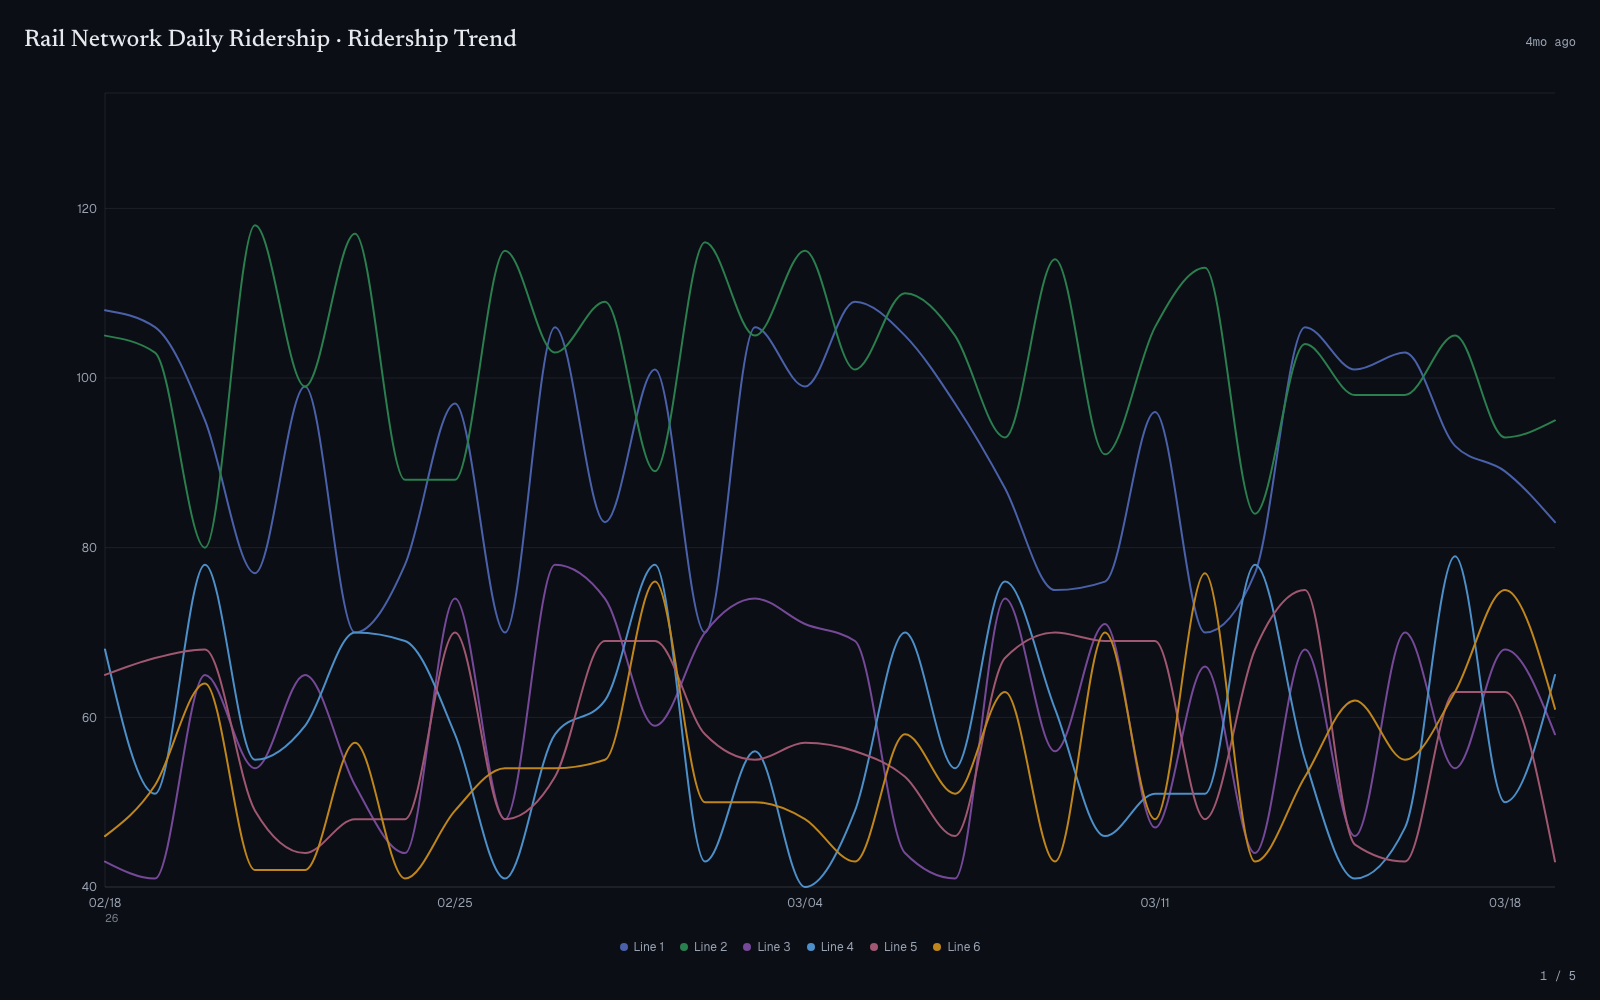
Once configured it runs on two timers: each widget holds the screen for 15 seconds, and the data behind every widget refreshes every 60 seconds. A counter in the corner shows the position in the rotation. Where the viewer's system asks for reduced motion, the slide transition is dropped.
What it does when the data stops
The wall keeps showing the last known values and puts an honest banner above them:
Live data unavailable. Showing last known values.
It also stops refreshing while the connection is down, and that is deliberate rather than an oversight: a refresh attempted during an outage would come back empty and replace the good values on screen with nothing. Freezing the numbers and labelling them is better than a blank wall in a room full of people, so the banner carries the doubt instead.
Widget order has the same caveat as presentation mode: the rotation follows the order the server returns widgets in, not the way the dashboard is arranged.