Visualizations
Every query can carry any number of saved visualizations, shown as tabs on the query page and placeable as dashboard widgets. Creating or editing one opens a two-panel dialog: the type selector and its options on the left, a live preview on the right. The type is chosen at creation and locked afterwards; everything else can be edited at any time.
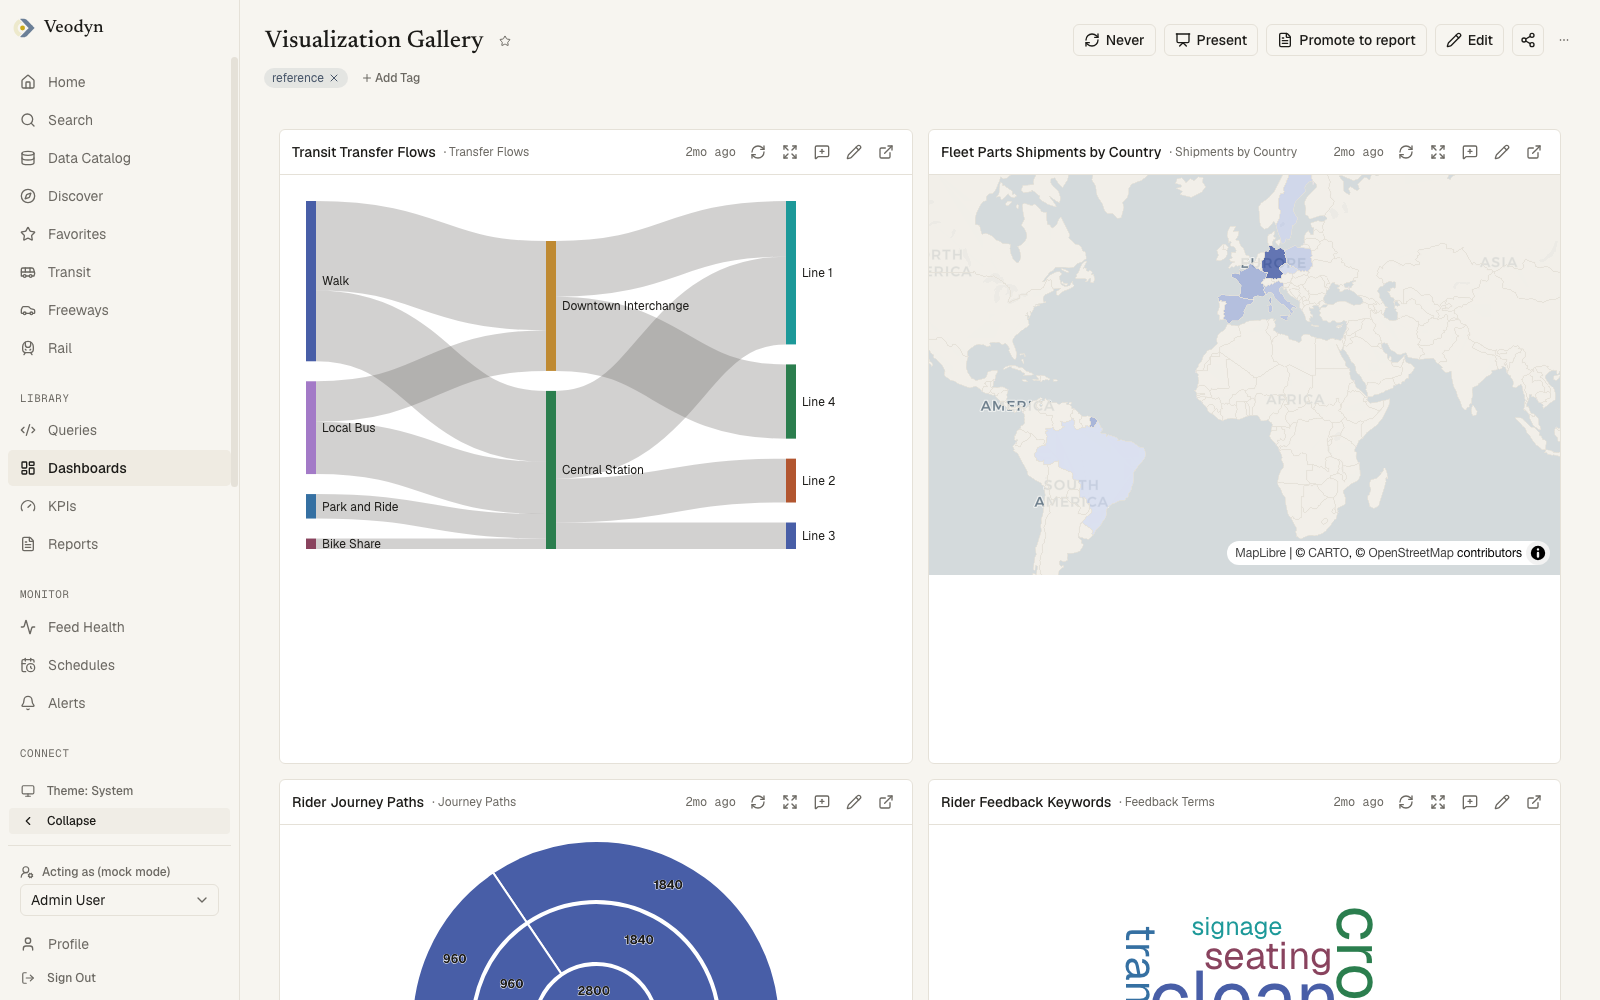
The 15 core types
| Type | What it draws | Key options |
|---|---|---|
| Table | The result rows | Per-column visibility and display: Text, Number, Date and time, Boolean, Link (URL template), or Image |
| Chart | Line, bar, area, pie, or scatter | See the chart editor below |
| Counter | One big number | Value column and row, optional target column, decimals, prefix/suffix, or plain row count |
| Pivot Table | Cross-tabulation | Row field, column field, value field, aggregation |
| Funnel | Stage-by-stage drop-off | Step column, value column, sort order |
| Details | One record as a field list | Visible columns |
| Map (Markers) | Points on a map | Latitude/longitude columns, group-by marker color, popup template |
| Heatmap | A value grid | Column mapping, aggregation, row sort, value labels (auto-hidden on dense grids) |
| Box Plot | Distribution per category | Category and value columns |
| Sankey | Flows between nodes | Source, target, value columns |
| Choropleth | Values shaded onto regions | Map type, key/value columns, and which map property keys match against |
| Cohort | Retention over time | Cohort, stage, value, and total columns |
| Sunburst | Hierarchical sequences | Value column |
| Word Cloud | Term frequency | Words column, optional frequency column, count and length limits |
| KPI history | A KPI's value over time with its bands | Time/value columns, target, unit, direction, at-risk and breached bands. It draws from a KPI, so it has nothing to show without that enterprise feature |
Rather than rendering an empty box, each type validates its own configuration and explains specific problems: a chart whose mapped column no longer exists, or a choropleth with no matching property selected, tells you exactly what to fix.
Adding one
The + beside a query's visualization tabs opens New Visualization: pick a type, configure it against the query's current result, and Save adds a tab. Cancel leaves the query as it was.
The type list is built from what this instance actually offers, so it is the authoritative answer to "what can I make here". It is the 15 core types above, plus any plugin types whose audience includes you.
A type can be installed and working yet absent from this list. The reference tenant, for example, ships five plugin visualizations but offers four, because one is marked internal. If a type you expect is missing, Admin → Plugins says whether it is installed and who it is offered to, which is the difference between "not available here" and "not available to you".
The chart editor
The Chart type covers the five classic shapes and has the deepest editor:
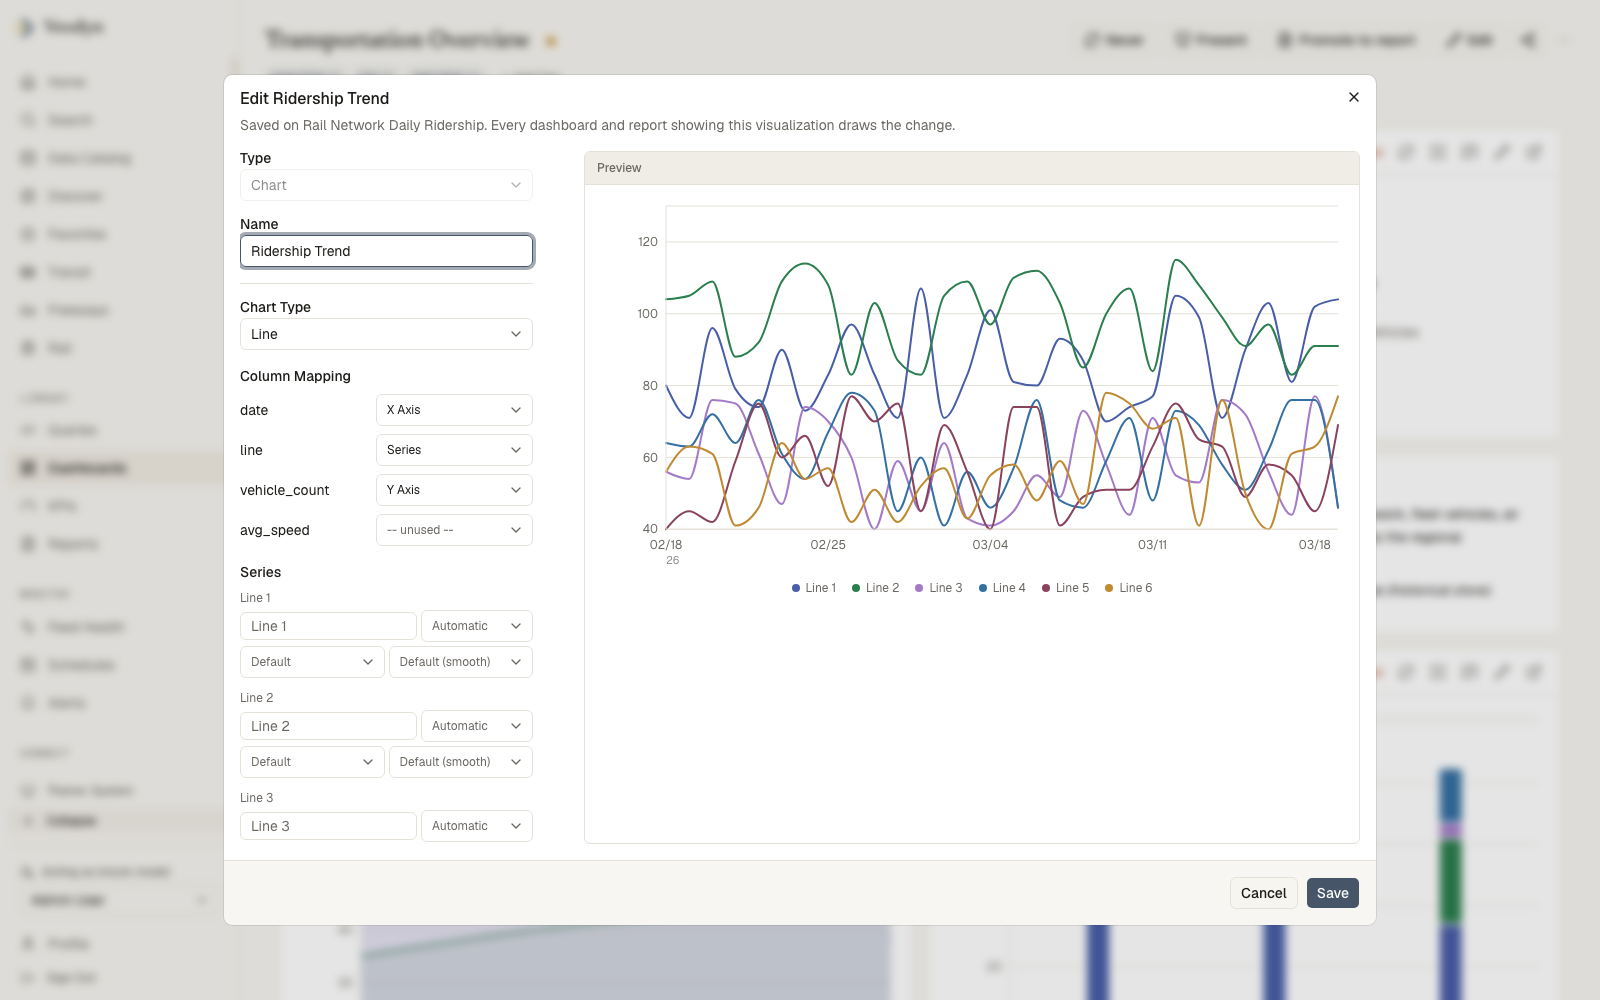
- Chart Type: Line, Bar, Area, Pie, Scatter.
- Column Mapping: assign each result column a role: X Axis, Y Axis, Series, extra Y series, or unused.
- Stacking (bar and area): Disabled, Stack, or Percent.
- Horizontal bars (bar): swap the axes.
- Donut (pie).
- Series: one row per series the preview actually draws, each with Rename, a Color picker over the instance's chart palette (plus Automatic and any custom hex already saved), and, for line/area, a Shape override (line, bar, area, for combo charts) and a Curve style (smooth, linear, step, natural).
- X axis: Auto-detect or Datetime, and a reverse toggle. Hidden for pie.
- Y axis: log scale, a min/max range, and Index to 100 for comparing series' relative movement. Mutually exclusive combinations explain themselves (an indexed chart is always linear with an automatic range; indexing is unavailable while stacking is on).
- Reference Lines: horizontal value lines with labels.
- Show data labels.
Charts always draw from the instance's configured palette, so series colors stay consistent (and accessible) across the whole product.
Where visualizations appear
- Query pages, as tabs with add/edit/delete.
- Dashboards, as widgets; the widget menu's "Edit visualization" opens the same dialog.
- Embeds and public links, rendering a single visualization to anonymous viewers.
- Reports (enterprise), as data blocks rendering a chosen visualization type over a query snapshot.
Extending and restricting the set
Operators can restrict which types analysts may create with the visualizations.enabled allowlist in the instance config; already-saved visualizations of a dropped type keep rendering.
Instances can also ship visualization plugins: custom types compiled into the frontend image (the reference tenant adds a camera slider, destination board, ticker, and transit line board). Admin → Plugins lists every installed package, what data it reads, and which audience it is offered to. How plugins work, what they are for, and how to author one is covered in Visualization Plugins.