Feed Health & Schedules
Two pages under Monitor answer the operational question "is the data current", for everyone rather than only admins.
Feed Health
/feed-health tracks the freshness of the instance's upstream data feeds. When a chart looks stale, this page says whether the problem is upstream. Search by feed name or source; every column sorts.
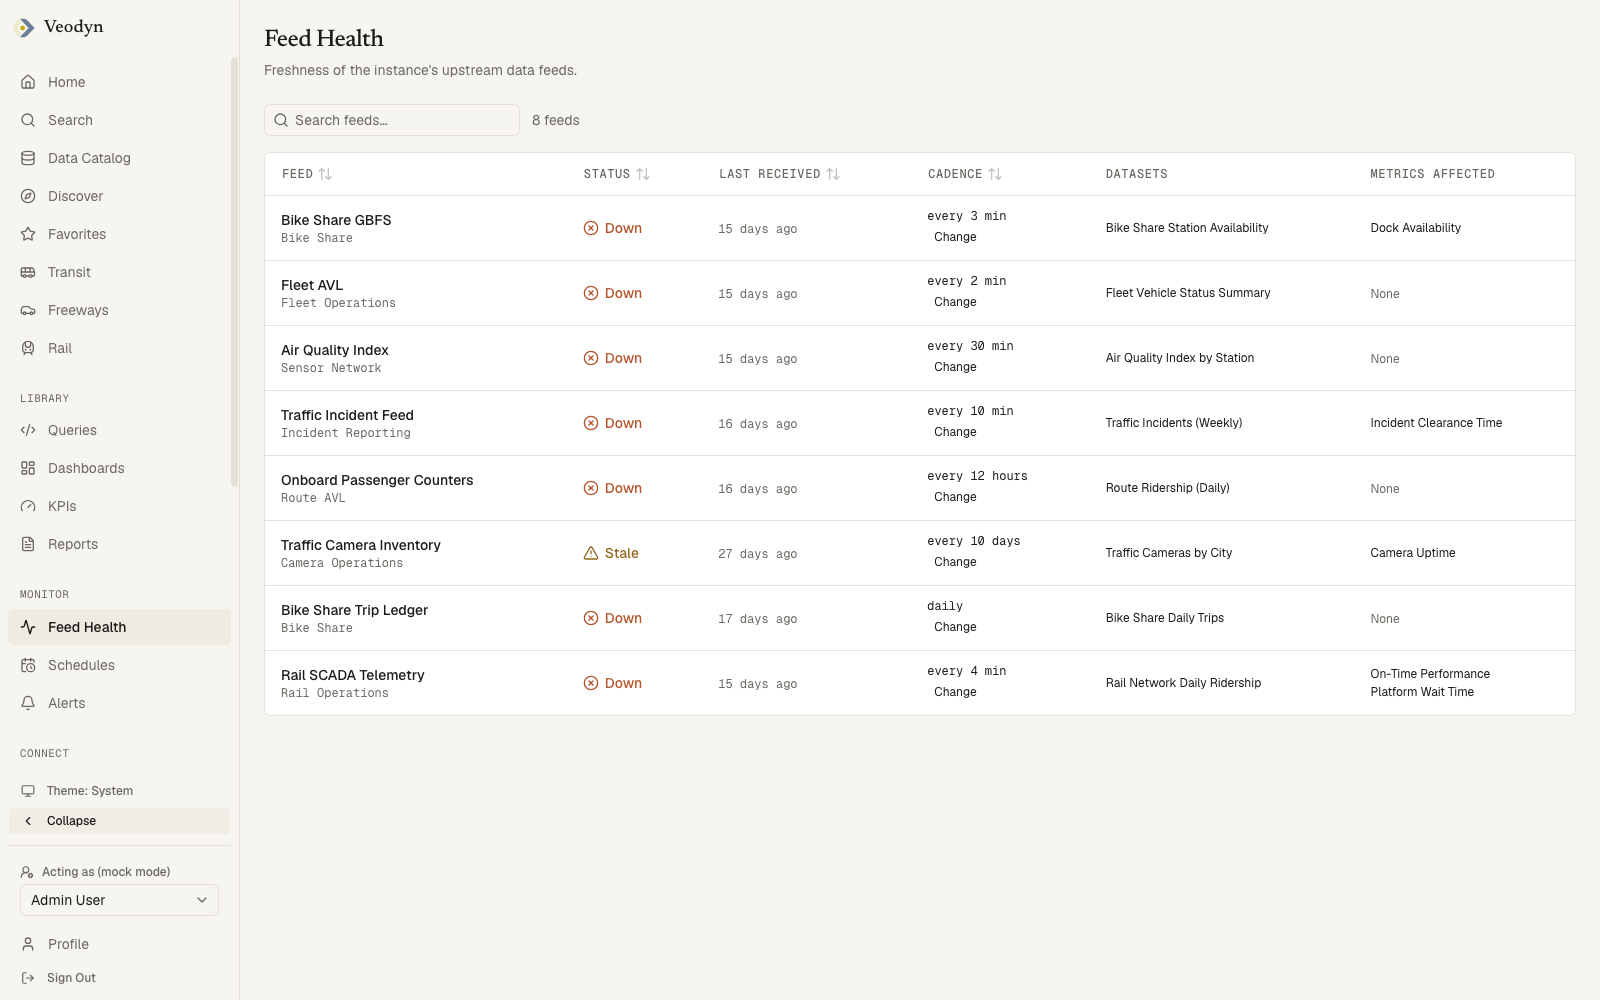
| Column | What it holds |
|---|---|
| Feed | The feed's name, with its source underneath (GBFS Bikeshare, GTFS-Realtime) |
| Status | Fresh, Stale or Down, and how that verdict was reached |
| Last received | When data last arrived |
| Cadence | How often it is expected, plus a control to set that expectation |
| Datasets | The catalog datasets this feed populates, each a link |
| Metrics affected | The KPIs that read those datasets, or None. Enterprise: a community build has no KPIs, so this column reads None throughout |
Read the line under the status
A status can be reached two ways, and the page tells you which:
- Derived from the cadence and the last received time. The Cadence column shows the interval, marked expected where the cadence was declared rather than observed.
- as reported, printed under the status, meaning the feed's own claim about itself. Nothing has been checked. The Cadence column then reads None declared, so age is not checked.
That distinction is the page's most useful detail. A feed with no declared cadence cannot be judged late, however long it has been silent, so a green Fresh marked as reported is an upstream assertion rather than a verdict. Set an expected interval on such a feed and the status becomes something the product can check for you.
Metrics affected is the blast radius (enterprise)
This column answers the question a stale feed actually raises: what breaks. It traces the feed to its datasets and on to the KPIs computed from them, so a feed that has been silent for eleven days will name the metrics quietly reading old numbers, or say None when nothing depends on it.
Metrics are enterprise, so on a community build the trace has nothing to reach and every row reads None. The rest of the page, including the verdict and the cadence expectation, is community.
Schedules
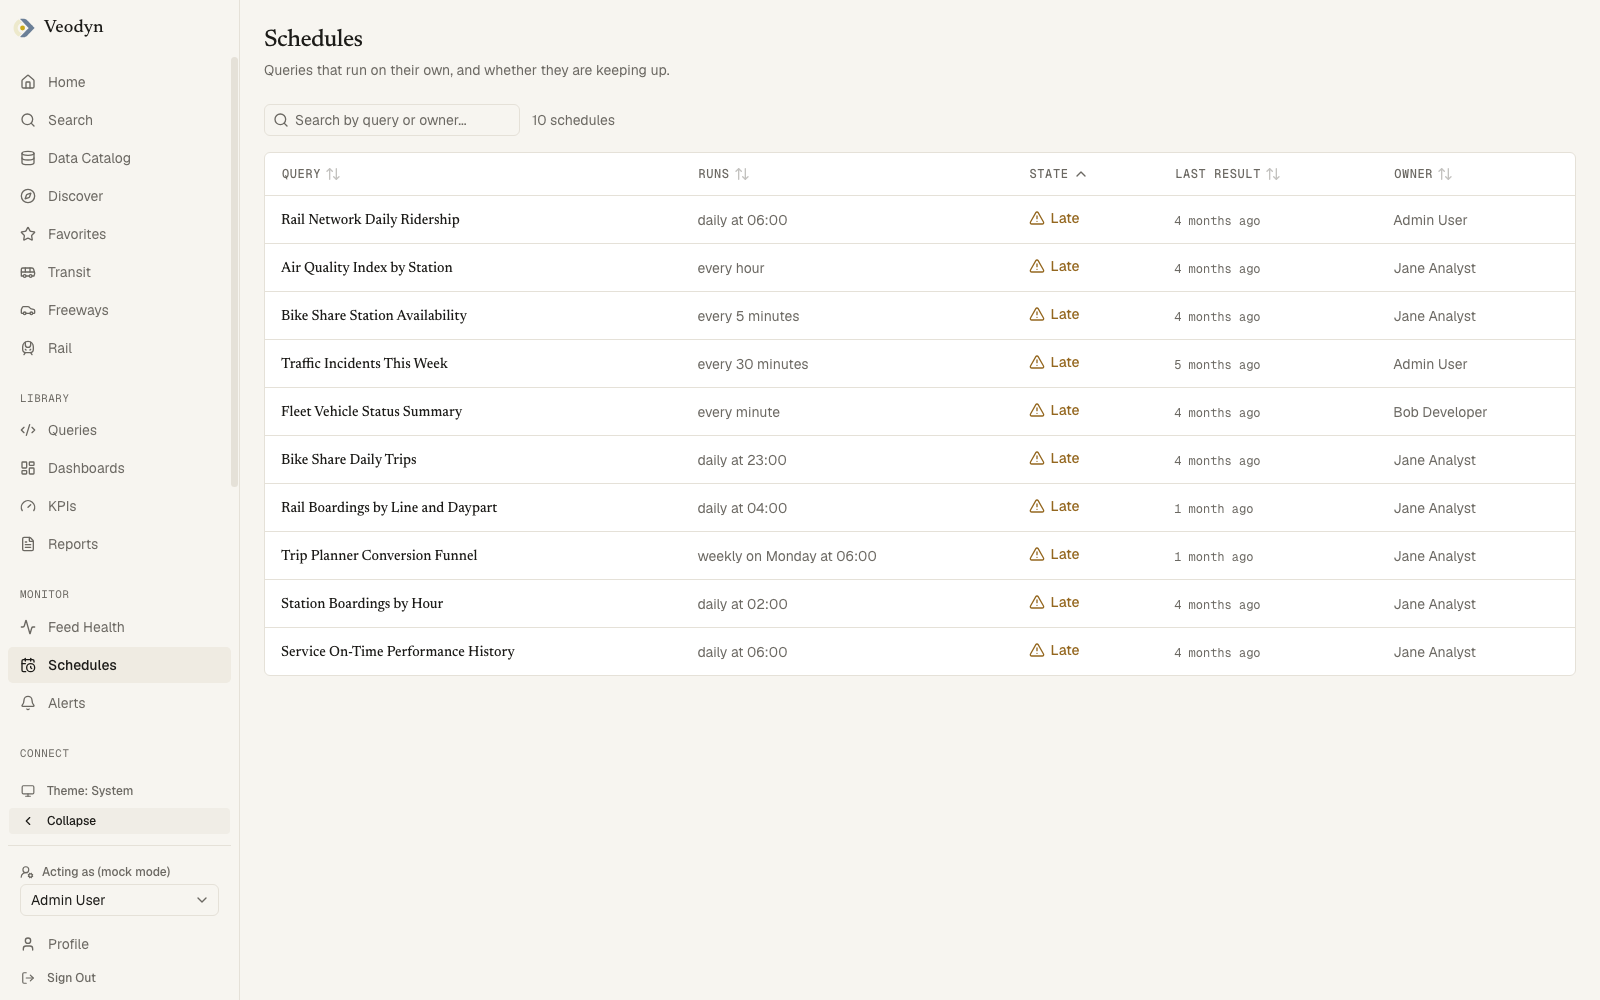
/schedules lists every query that runs on its own and whether it is keeping up: the query, how often it runs, a state (On time / Late / Expired), its last result, and the owner. Search by query or owner; every column sorts. It is the org-wide view of the schedules users attach to their queries.
Last result here is the same field, with the same wording, as on the query's own page: when the rows were last fetched, not when the query was last edited. The two screens deliberately report one number for one thing.
The list reads the whole library rather than a first page, so a late schedule cannot hide by sitting further down than the page happened to read.
Deeper, admin-only views of the same machinery (worker queues, outdated queries, backend status) live under System Administration.