Queries
Queries are saved SQL (or, for API-backed sources, JSON descriptors) you can run, schedule, visualize, and build dashboards from. They live in Library → Queries.
The query list
Library → Queries is the whole library, four ways.
Header buttons: New Query, and Create with AI when AI is enabled. With AI off the second button is absent rather than disabled, so the header holds one button and New Query keeps the position you reach for either way.
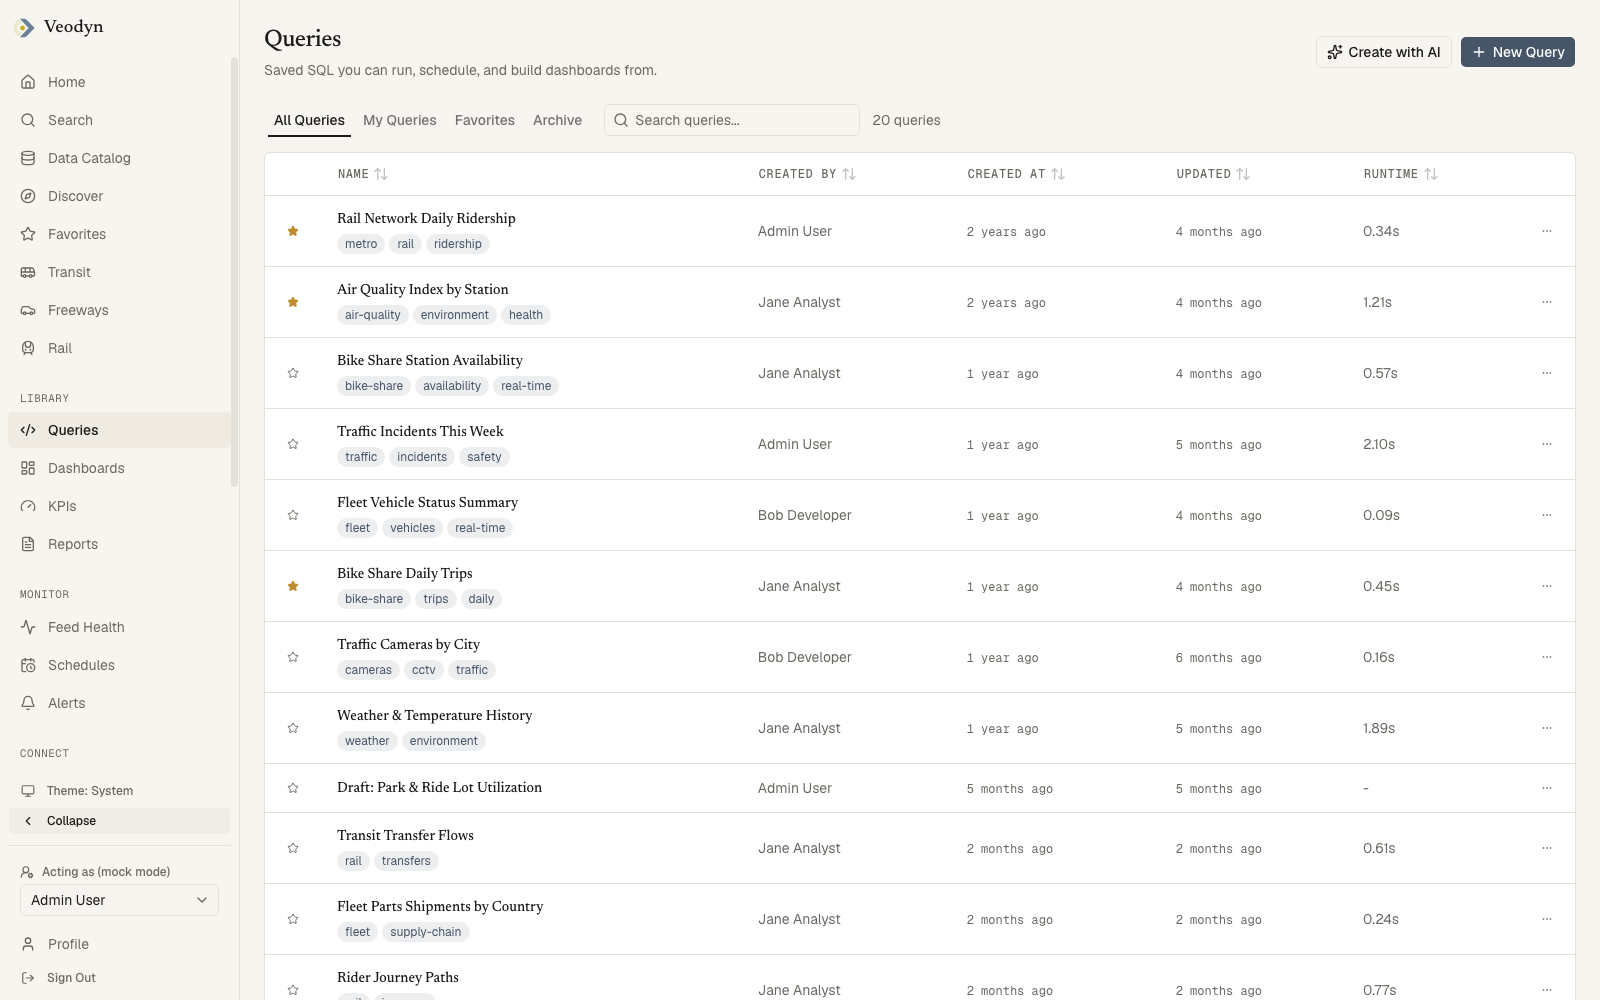
The four tabs
| Tab | Shows |
|---|---|
| All Queries | Every query in the instance that is not archived |
| My Queries | The ones you created, not archived |
| Favorites | The ones you starred, not archived |
| Archive | Everything archived, by anyone |
The tabs are real links (/queries?tab=my), not client-side state. A tab is bookmarkable, the back button steps between tabs, and reloading keeps the one you were on.
If the drafts feature is on, a draft is listed for its author and for nobody else, so All Queries is "everything shared, plus my own drafts" rather than literally everything.
Searching and counting
One text field, labelled Search queries, matching a query's name and its description, case-insensitively. Beside it a live count reads "20 queries", and it updates as you type so the list never shrinks silently.
Search narrows All Queries only. On My Queries, Favorites and Archive the field accepts what you type and the list does not change, so treat those three as complete lists you sort and page rather than search.
Search runs on the server, so it reaches the whole library rather than the rows already on screen. The rest of the tabs are read in full, up to 2,000 rows. Past that the list stops and says so above the table, and asks you to search rather than letting the last page look like the end of the library.
The columns
| Column | Contents | Sortable |
|---|---|---|
| (star) | Favorite toggle; filled and amber when starred | no |
| Name | A link to the query, with its tag chips underneath | yes |
| Created By | The author's name, or - | yes |
| Created At | Relative age | yes |
| Updated | Relative age of the last edit | yes |
| Runtime | Last run's duration in seconds, or - if it never ran | yes |
| (kebab) | The row's actions menu | no |
Sorting runs over the whole library and paging happens after it, so "sort by runtime" means the slowest query in the instance rises to the top, not the slowest of the 25 rows in front of you. Rows with nothing in the sorted column sort last in both directions: missing is not the same as smallest, and a descending sort should not bury exactly the rows you are looking for.
Lists break at 25 rows. A shorter list shows no paginator at all. Changing tab or search returns you to page 1, since that is a different list; re-sorting the same list keeps your page.
Clicking a row
The whole row opens the query, by mouse or by Enter or Space from the keyboard. Three things inside a row do something else instead, and none of them navigate: the star toggles the favorite, a tag chip searches for everything carrying that tag, and the kebab opens the row menu.
The row menu
One control per row, holding whatever you may do to that row.
| Tab | Action |
|---|---|
| Archive | Restore, which returns the query to the library and asks nothing first |
| Every other tab | Archive, which is destructive and asks first |
You see the menu only if you may act: the owner of the query, or an admin. Anyone else gets no kebab at all, rather than a menu holding one greyed-out item with no explanation. Being granted edit access to a query through its permissions list is not enough, because the backend guards archiving on ownership alone.
Archiving asks first, and it should
Archive opens a confirmation that names the query and states the cost:
Its alerts, its refresh schedule and any dashboard widgets built on it will be removed, and those do not come back. The query itself can be restored from the Archive tab.
That is the actual behaviour, not a caution. Archiving a query deletes every alert on it, clears its refresh schedule, and deletes every dashboard widget built on any of its visualizations. Restore brings back only the query. A restored query looks entirely intact and has quietly stopped running, which tends to surface a week later as a stale number on a dashboard.
Either outcome is reported in a toast. A refusal names the reason: you must own the query, or be an admin.
When the list is empty
An empty list, and a search that matched nothing, both read No queries found. A fresh instance therefore looks the same as a bad search, so check whether the search box still holds a term before concluding there is nothing here.
Drafts
Off by default. With the query_drafts feature switched on, saving a query does not yet share it: the query is listed for its author and is invisible to everyone else until they use Share with the team from the query's own actions menu. With the switch off there is no draft step, saving a query shares it, and the word "draft" never appears in the product.
Reading a query
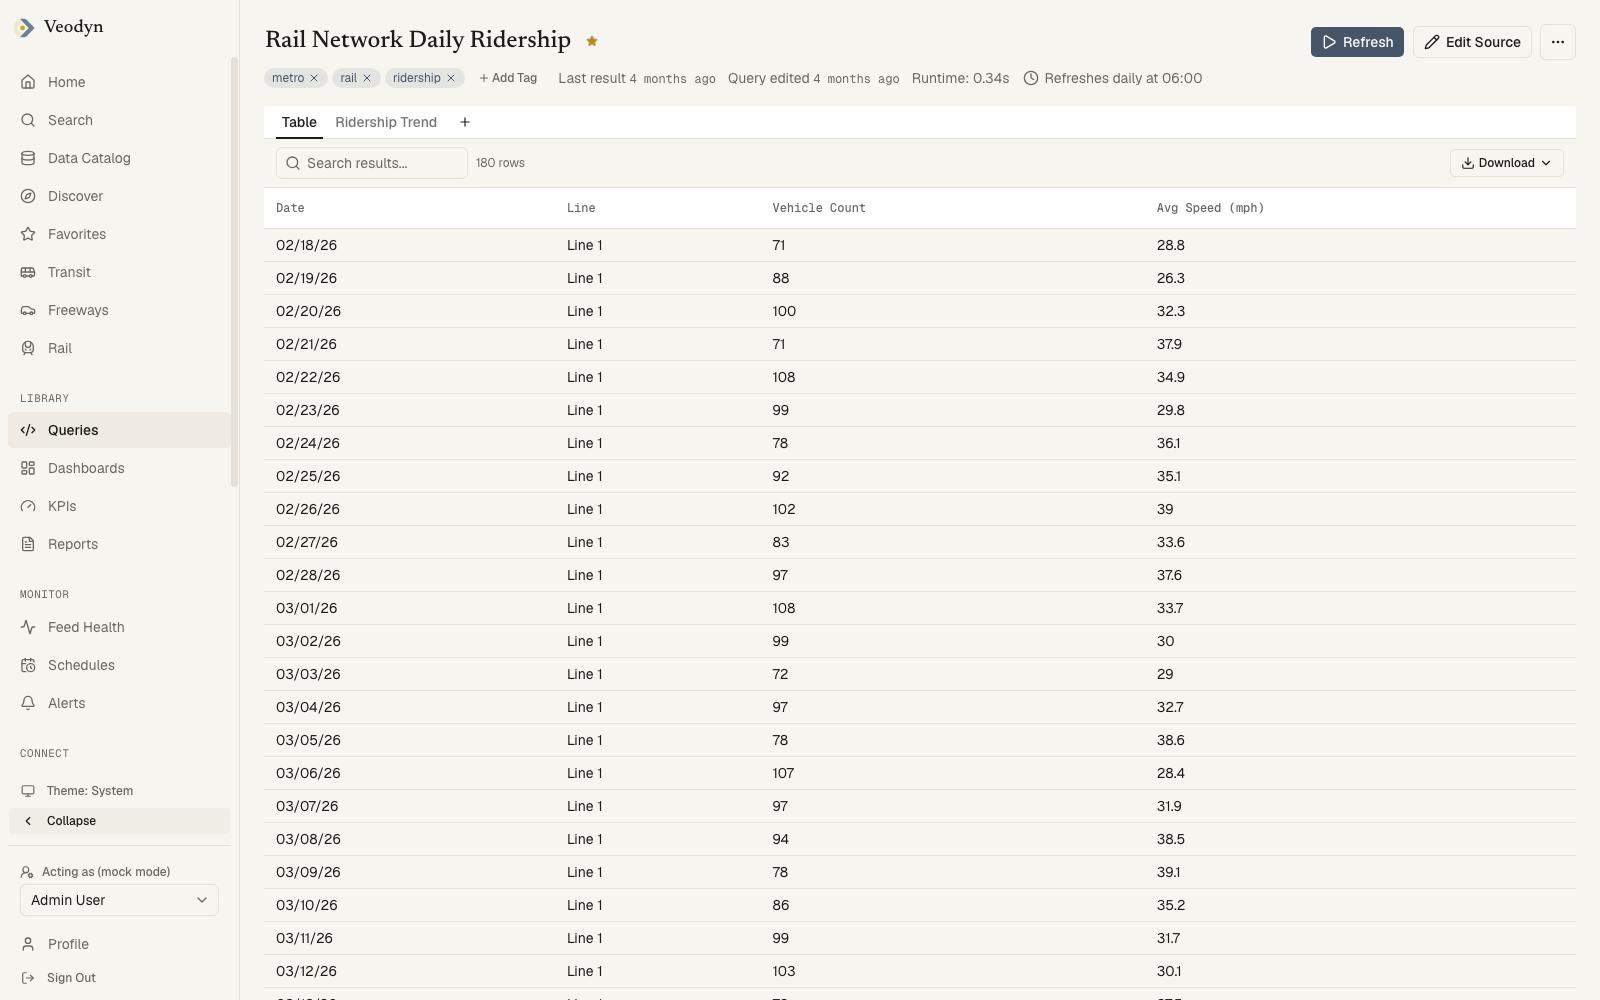
This is where a reader lands: the query's results, not its SQL.
The title is editable in place, click it and type. Beside it sit the star, and a Draft badge when the drafts feature is on and the query has not been shared yet. Tags below are editable by anyone who can edit the query, and read-only chips for everyone else.
The two ages, and why there are two
The header states them separately, and the distinction matters:
| Label | Means |
|---|---|
| Last result | When the rows currently on screen were fetched |
| Query edited | When the query itself was last changed |
| Runtime | How long the last run took, when it has run |
A single "Updated" time on a page whose body is a results table reads as the age of those rows, and it is not. Setting a refresh schedule changes no data at all, yet it would flip that one timestamp to "just now" while every value on screen stayed identical. Last result is also the wording Schedules uses for the same field, so the two screens report the same number for the same query.
Running it again
Refresh re-runs the query and reports either way, so a run that finishes in milliseconds still tells you it happened rather than looking like a dead button. Edit Source opens the editor. The overflow menu holds everything else, listed under the query actions menu.
If the query takes parameters, a bar sits above the results. Values are staged, not live: type into it and the bar reports how many changes are not yet applied, and Refresh is unavailable until you apply them. A run started with edits pending would use the values you can see you replaced and say nothing about it, so it is blocked instead.
Once applied, those values stick for later refreshes on this page. Relative presets like Last 7 days resolve when the query runs rather than when you picked them, so a preset means the seven days before this run, not before your click.
Below all this are the query's visualization tabs: one per saved visualization, a + to add another, and per-tab edit and delete. A query that has never run offers a run control in the empty results panel, so you are not hunting for the header button. See Visualizations.
A query id that does not exist says Query not found.
The SQL editor
The editor (also used by New Query) is a full authoring surface:
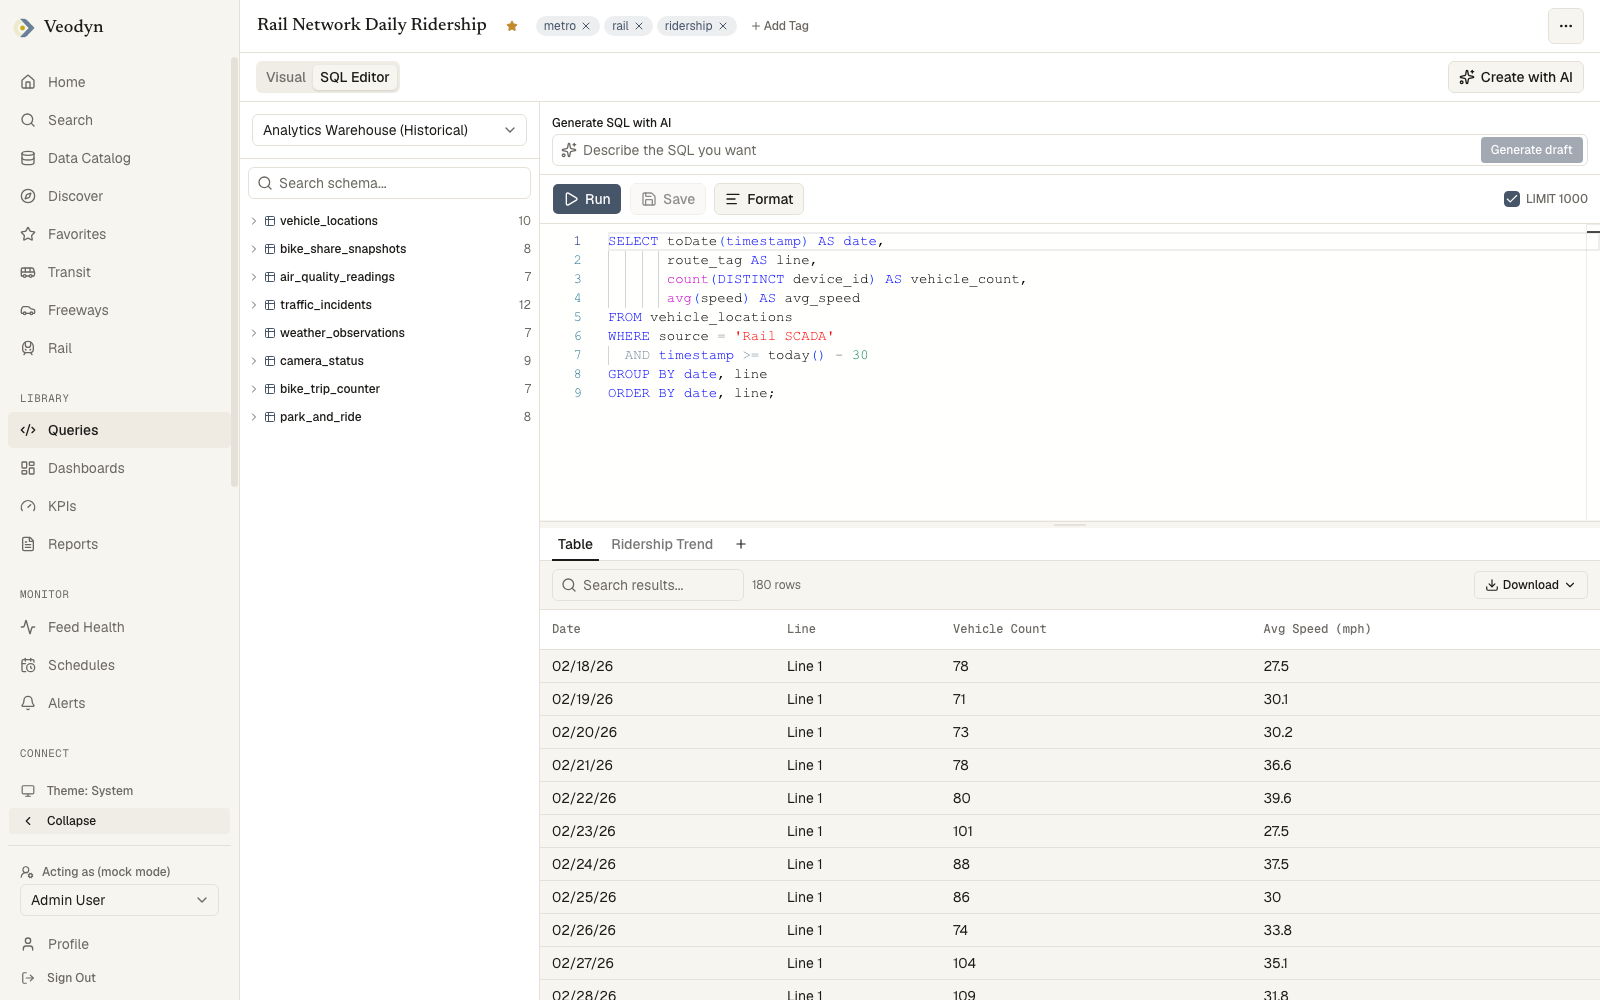
- Schema browser on the left: pick a data source, search the table tree, click a table or column name to append it to your SQL, or preview a table's contents. Each table shows how many columns it has, and the search says No matches against a schema it has, No schema available against one it does not.
- Monaco editor with a Format button, a LIMIT 1000 toggle, and Run / Save.
- Results pane below: a searchable, sortable, paginated table with CSV and TSV downloads. A failed run shows what the data source said.
Run, Save, and LIMIT 1000
Three controls sit above the editor, and each has a rule worth knowing.
Run sends what is in the editor, not what is saved, which is what makes the editor useful for trying something before committing to it.
Save is unavailable until the buffer differs from what is stored, and carries an asterisk while it does, so Save * means there is something to write and a plain Save means the stored query already matches. That asterisk is the dirty indicator; there is no separate one.
LIMIT 1000 is on by default and appends a row cap to what you run. Untick it when a query needs the whole result, remembering that the pane below then has to render it.
The word is Run here and in the Visual builder, for the same action, so the two halves of the editor do not ask for the same thing with two different verbs.
Reading the results
The results pane carries its own search box, filtering the rows already fetched rather than re-running anything, and a row count. Download offers CSV and TSV of the full result.
Above the pane are the query's visualization tabs, so a chart can be built and checked without leaving the editor.
- AI prompt bar (when AI is on): describe what you want, get draft SQL placed in the editor for you to read, never auto-executed. See AI Features.
Unsaved changes are marked with a dirty indicator next to the name.
Starting a new query
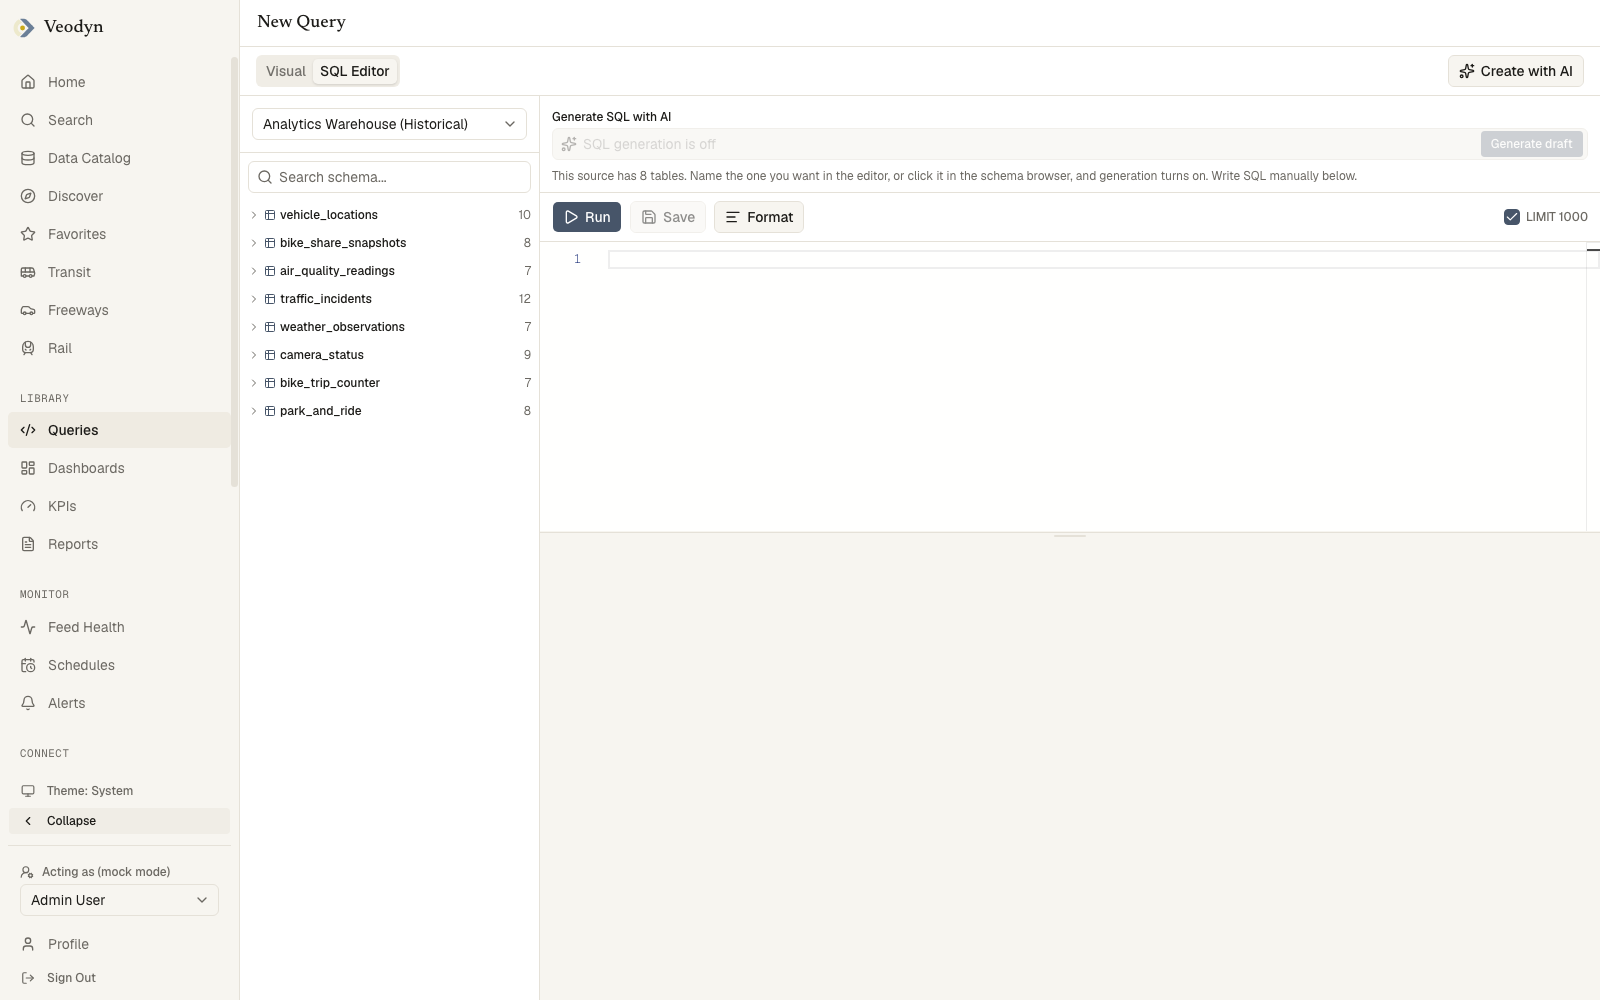
New Query opens the same editor with nothing in it, against your default data source. The schema browser lists that source's tables with a column count each, and changing the source changes the tree.
Save is unavailable until there is something to save. Saving creates the query and moves you to its own URL, so the address changing from /queries/new to /queries/<id>/source is how you know the query now exists. Until then nothing has been written.
Parameter definitions are saved with the SQL that declares them, never separately. A query whose text mentions a parameter it has no definition for is one the backend refuses to run, so the two always move together.
With the drafts feature off, saving also shares the query with the team, because a query nobody else can find is not a state the product offers. With drafts on, saving leaves it yours until you share it.
Why the AI bar is sometimes greyed out
The bar has to know which table you mean before it will generate anything, so on a blank editor it starts switched off. Read the grey line underneath it, not the text inside it. The hint below gives the actual reason; the placeholder in the box says only SQL generation is off for this data source, whatever the reason turns out to be.
| The hint says | What it means |
|---|---|
| This source has N tables. Name the one you want... | Nothing is wrong. Type a table name into the editor, or click one in the schema browser, and the bar turns on |
| <name> is not a table SQL can read | What you named cannot go in a FROM clause. Some sources expose documentation entries that browse like a schema but are not tables |
| This source exposes no table SQL can read | There is nothing here to generate against |
| <source> takes <syntax>, not SQL | Not a SQL source, so generation does not apply |
Only the last two are genuinely about the data source. The first is what you meet on every new query, and it clears the moment you name a table.
The editor below is fully usable throughout. The AI bar is an accelerator, not the way in.
Parameters
Add {{ parameter }} placeholders to your SQL and Veodyn renders a control for each in the parameters bar. Parameter types: Text, Number, Dropdown List, Query Based Dropdown List, Date, Date Range, Date and Time (and with-seconds variants). Each parameter's settings (title, type, allowed values, multi-select, quotation) live behind a per-parameter gear, visible to editors.
Edits to parameter values are staged: the bar shows "N changes not applied" until you press Apply Changes, and relative date presets like "Last 7 days" resolve at run time, not when picked.
The Visual builder
When AI is enabled, the editor gains mode tabs: Visual and SQL Editor. The Visual builder composes SQL deterministically from your picks, with no model in the loop:
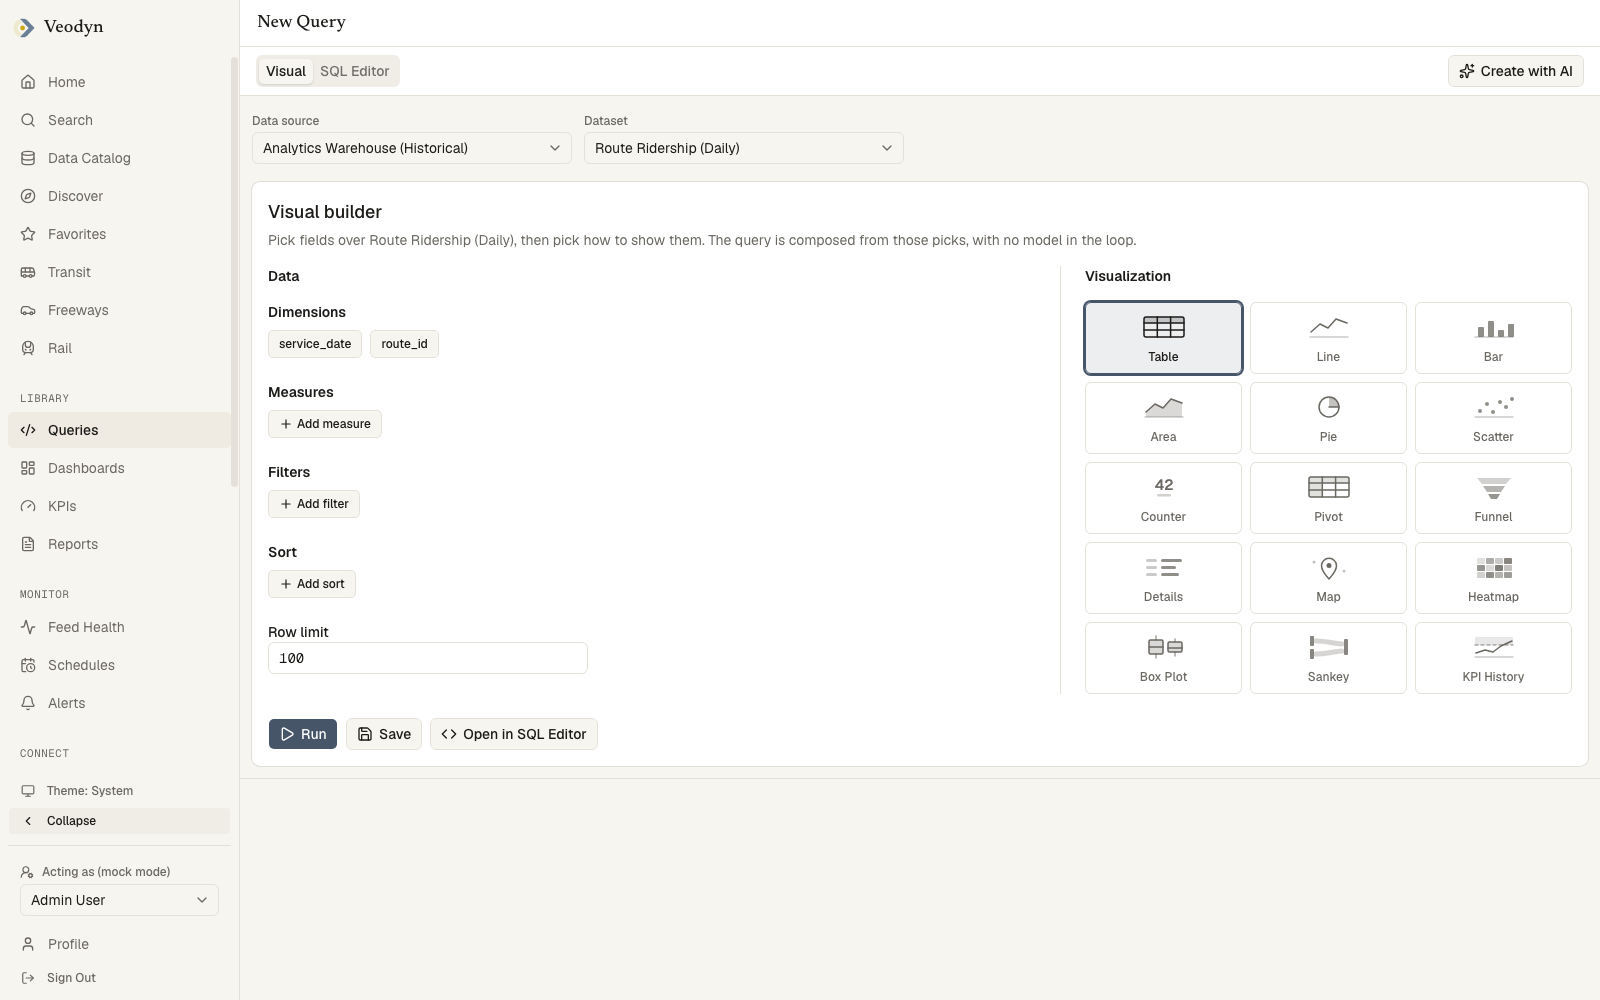
- Data: pick a dataset, then Dimensions, Measures (column + function + alias), Filters, Sort, and a row limit.
- Visualization: pick how to show it from thumbnail tiles.
- Run, Save, or Open in SQL Editor to continue by hand.
Anything the builder cannot express (a cross-dataset join, a dataset with no column metadata) is stated plainly with a pointer to the SQL editor.
The query actions menu
The kebab menu on a query gathers everything else, shown only when you hold the permission:
| Action | What it does |
|---|---|
| Fork | Copies the query so you can modify it without touching the original |
| Schedule | Runs the query on a cadence: from every minute to every 24 hours, or weekly, with an optional end date and a time/day picker |
| API Key | Reveals the query's results API key, with copy and a confirmed Regenerate (the old URL stops working) |
| Embed | For queries marked safe: a public URL and iframe snippet for one visualization, with width/height |
| Add to Dashboard | Pick one of the query's visualizations and a target dashboard, or create a new dashboard on the spot |
| Permissions | Manage the per-query permitted-users list |
| Archive | Retires the query, after a confirmation that names what else goes with it. See Archiving asks first |
| Make it a draft / Share with the team | Only with the drafts feature enabled: controls whether the query is listed for the team yet |
Scheduled runs and their punctuality are visible org-wide under Monitoring.
Query snippets
Reusable SQL fragments, shared across the org. Off by default: with the query_snippets flag off, Library → Query Snippets is absent from the sidebar and the URL itself returns 404, rather than showing a page that cannot do anything.
With it on, the list shows every snippet by Trigger, Description and Snippet, searchable by trigger or description. New Snippet asks for those same three, of which the trigger and the body are required, and the row menu offers Delete.
How a snippet reaches your SQL
Through the Snippets panel in the editor's left sidebar, below the schema browser: each snippet is a row, and clicking it inserts the fragment at your cursor.
The Query Snippets page describes snippets as "expanded by typing their trigger in the editor". Typing a trigger does nothing here. That text is inherited from the query service's own legacy UI, whose behaviour this product replaced with the click-to-insert panel above. The editor's autocomplete offers table and column names from the schema, not snippet triggers.
Deleting a snippet removes it for everyone in the org and cannot be undone, which the confirmation says before you commit to it.